

ResearchTime & everyday life
Where our free time goes
TV, games, conversations, a moment to think. A visual guide to American leisure—and the different lives hidden inside an average day.
One average.
Millions of
different days.
A snapshot of people age 15+ in the U.S. Some days have more room for leisure. Others have less.
“Five hours of leisure” can sound like a large, empty space on a calendar. The data describes something more complicated: television after dinner, time with friends, a game, exercise, reading and other activities, averaged across very different people and days.
The 2025 American Time Use Survey gives that picture a shape. It does not tell us that everyone has five uninterrupted hours to spare, or which activity makes those hours well spent.
01 / THE MIX
TV takes the biggest share
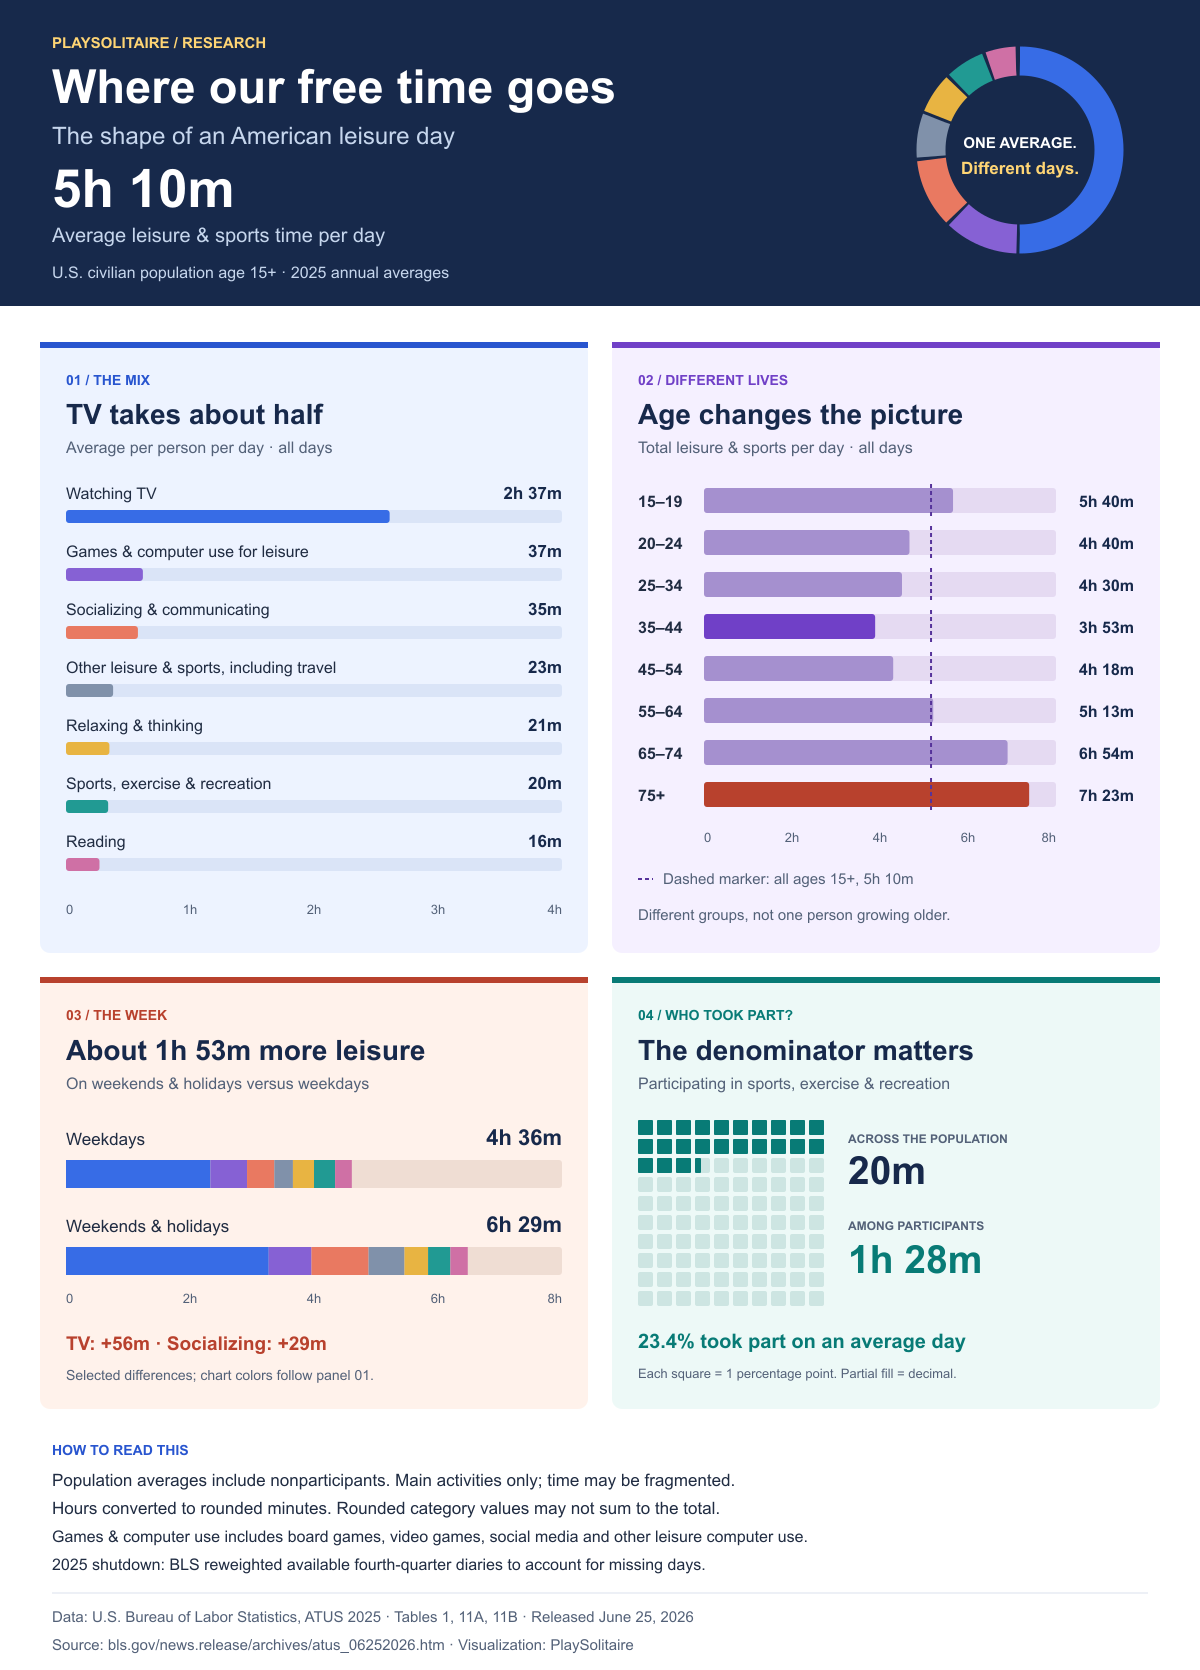
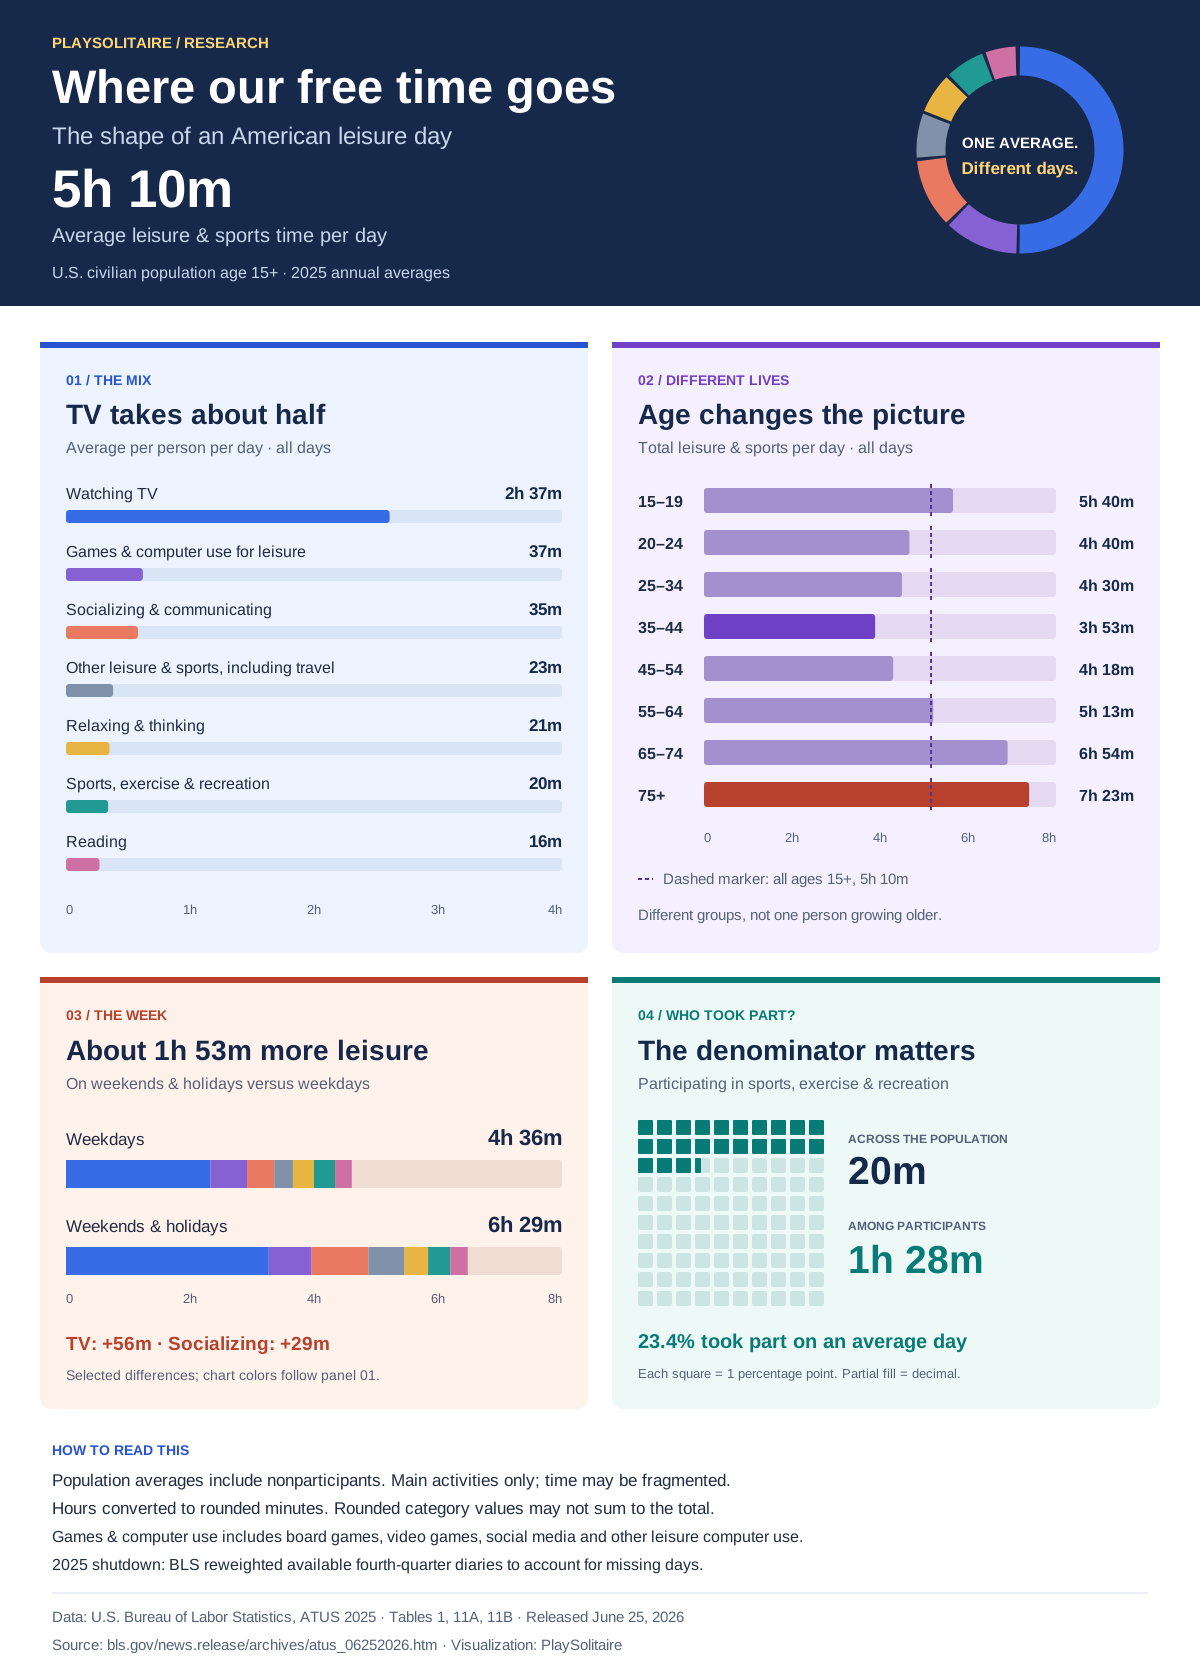
Watching television accounts for about half of all leisure and sports time: roughly 2 hours 37 minutes per person per day. The rest is spread across activities that range from socializing to simply relaxing. Viewing time does not tell us which paid services a household uses; our guide to reviewing unused entertainment subscriptions treats that as a separate inventory of costs and use.
Seven ways leisure adds up
Average time per person per day · U.S., age 15+ · 2025
Total leisure5h 10m
02 / THE AGE GAP
An average day looks different at different ages
People ages 35–44 reported the least leisure and sports time among the age groups shown. People age 75 and over reported the most. The gap between those published averages is 3 hours 30 minutes a day.
Leisure time across the age groups
Average per day · all days of the week · 2025
difference
Work, education, family responsibilities and other circumstances differ across these groups. This chart does not separate their effects or establish that age itself causes the differences. A separate view of time spent alone across age groups examines who was present during recorded activities, while distinguishing being alone from feeling lonely.
03 / THE WEEK
Weekends make more room—but not evenly
Leisure and sports time averages 4 hours 36 minutes on weekdays and 6 hours 29 minutes on weekends and holidays. TV and socializing account for much of that difference.
About 1h 53m more leisure
Weekends & holidays compared with weekdays · age 15+
Colors follow the activity chart. The three callouts show selected differences, not the full total.
These are averages for the whole population, including people who work on weekends. “Weekend” describes the calendar here; it does not mean everyone had a day off.
04 / THE AVERAGE
Twenty minutes can hide an hour and a half
The average for participating in sports, exercise and recreation is about 20 minutes a day. Among people who actually did those activities on their diary day, the average is about 1 hour 28 minutes.
Both numbers are useful. They answer different questions.
Who is included in the average?
U.S., age 15+ · an average day in 2025
23.4% took part on an average day
Each square = 1 percentage point.A partial square shows the decimal.
Including people who did none that day
Time among that day’s participants
23.4% × 1.47 hours ≈ 0.34 hours across the population
The same distinction changes how we read other activities. A population average mixes the time of people who took part with zeroes from people who did not. It is not a typical session length.
FROM THE CATEGORY TO THE ACTIVITY
The same category can contain different kinds of choices
A time diary records an activity and its duration. A broad category does not preserve every detail of what someone was doing. Even within solo card games, the next choice can involve different actions:
Find a pair. In Pyramid Solitaire, two available cards can be removed when their values add to 13. An available king, worth 13, is removed on its own.
Choose the next rank. In TriPeaks Solitaire, an exposed card plays onto the waste when it is one rank above or below the top card. Suits do not affect that choice.
Rearrange a column. In Scorpion Solitaire, moving a face-up card carries the cards below it, even when that group is out of sequence. The selected card still needs a legal destination.
Those actions differ, yet all three examples belong to the broad idea of playing a game. The published time-use tables do not separate these titles or measure their popularity, session length or benefits. A population total describes how time was allocated; it cannot tell us which activity a particular person would enjoy.
About the data
This page visualizes the BLS American Time Use Survey, 2025 results, released June 25, 2026. BLS reports about 6,100 interviews in 2025. A selected person age 15 or over describes the previous day; BLS weights responses to produce population estimates.
- What “free time” means here: the BLS “leisure and sports” category, including related travel. It is not all time outside paid work, and it is not necessarily uninterrupted or free of responsibilities.
- What is counted: main activities. Simultaneous activities are not added to these totals. Someone can have a child in their care while reporting leisure as their main activity.
- A 2025 collection gap: the federal shutdown left no diary data for September 30–November 11. BLS weighted November 12–December 30 diaries to represent the fourth quarter, including the missing days.
- Precision: we convert published decimal hours to minutes and round to the nearest minute. Category totals, chart segments and converted values can differ slightly because of rounding.
- Interpretation: these survey estimates have sampling and nonsampling error. We present descriptive comparisons without significance tests; differences do not establish causes or rank the value of activities.
Definitions and methods: BLS technical note. Activity and age data: Table 11A. Day-type data: Table 11B. Participation data: Table 1. The dated release above preserves the 2025 edition.
See the numbers behind the charts
| Activity | All days | Weekdays | Weekends & holidays |
|---|---|---|---|
| Total leisure & sports | 5.16 | 4.60 | 6.48 |
| Watching TV | 2.61 | 2.33 | 3.27 |
| Playing games & computer use for leisure | 0.62 | 0.59 | 0.69 |
| Socializing & communicating | 0.58 | 0.44 | 0.92 |
| Other leisure & sports, including travel | 0.38 | 0.30 | 0.58 |
| Relaxing & thinking | 0.35 | 0.34 | 0.38 |
| Participating in sports, exercise & recreation | 0.34 | 0.34 | 0.36 |
| Reading | 0.27 | 0.27 | 0.28 |
| Age | Hours per day |
|---|---|
| 15–19 | 5.66 |
| 20–24 | 4.67 |
| 25–34 | 4.50 |
| 35–44 | 3.89 |
| 45–54 | 4.30 |
| 55–64 | 5.21 |
| 65–74 | 6.90 |
| 75+ | 7.39 |
| Activity | Population hours | Took part (%) | Participant hours |
|---|---|---|---|
| Sports, exercise & recreation | 0.34 | 23.4 | 1.47 |
| Socializing & communicating | 0.58 | 30.4 | 1.92 |
| Watching TV | 2.61 | 74.3 | 3.51 |
Take the data with you
A standalone visual summary, plus the source values and definitions used here. Credit BLS for the data and PlaySolitaire for the visualization.
Source values checked September 27, 2026. Original visualization and explanatory text by NM Media for PlaySolitaire.