Research / People & everyday life
How much of the day do we spend alone?
A quiet commute. A shared room. An evening to yourself. U.S. time diaries show how physical company varies across ages and living arrangements—and why being alone is not the same as feeling lonely.
awake and alone
Average daily time with no one else physically present, across the U.S. civilian noninstitutional population.
2025 American Time Use SurveySome parts of the day are naturally solitary. Others depend on the people we live with, the work we do and the places we go. A time diary captures that setting without assuming that every quiet hour is unwanted, or that sharing a room means sharing an experience.
01 / LIFE STAGES
A different balance at different ages
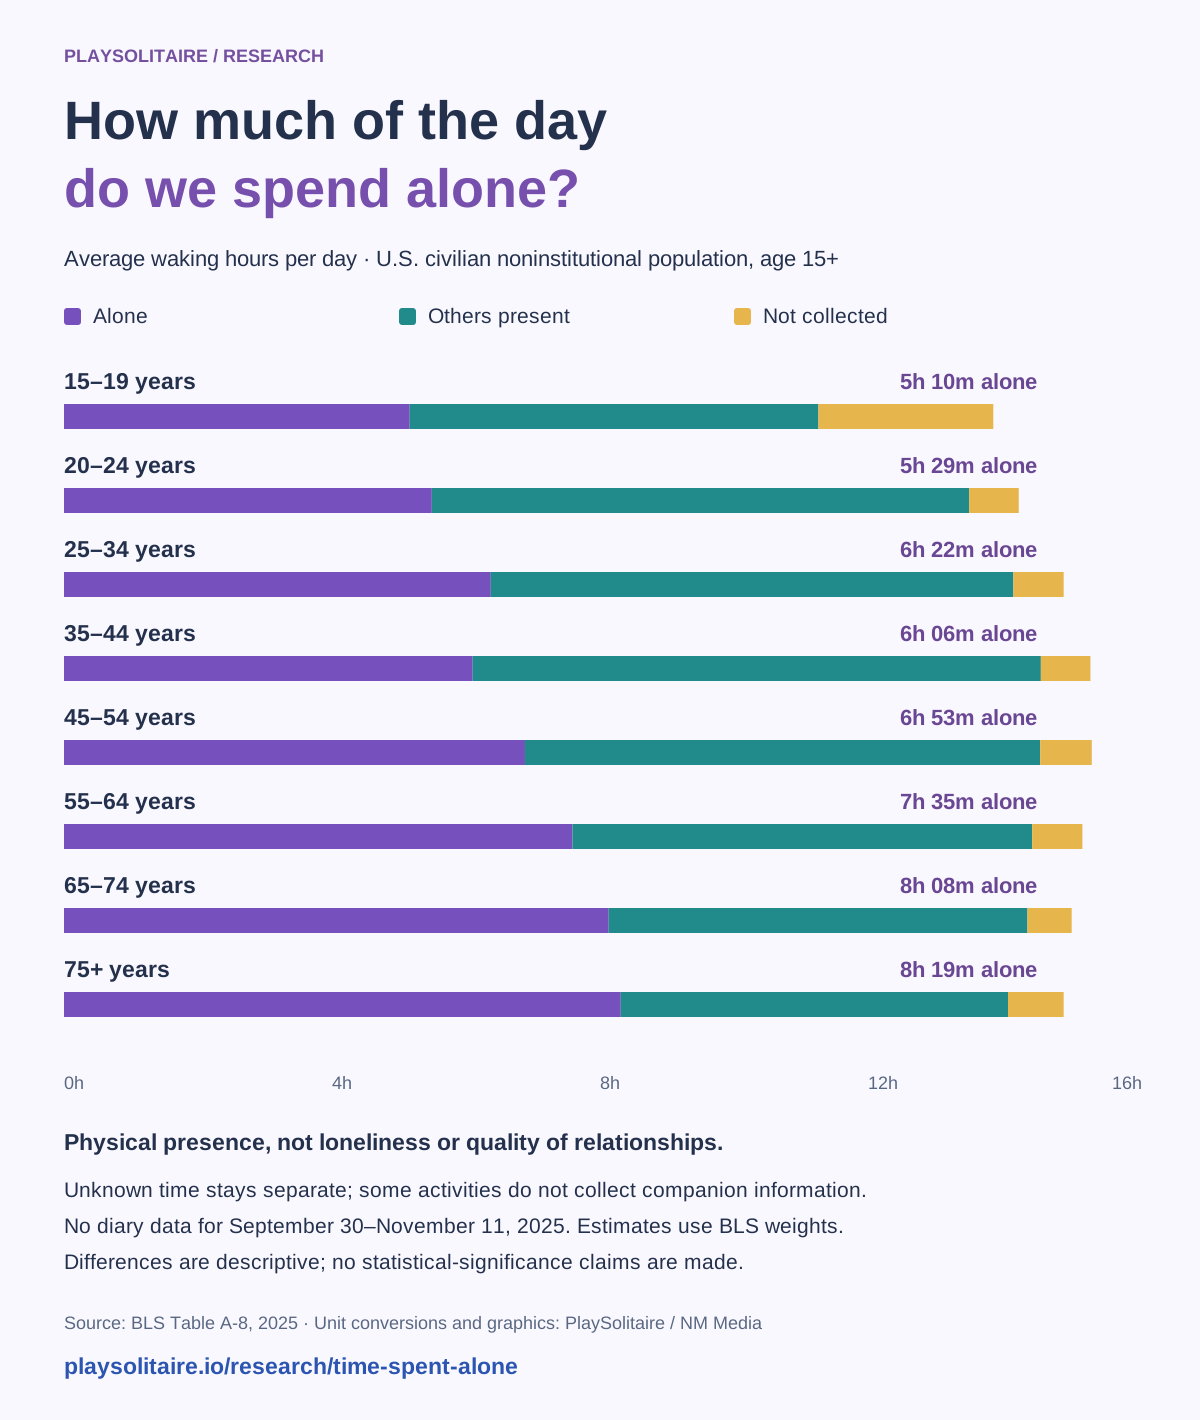
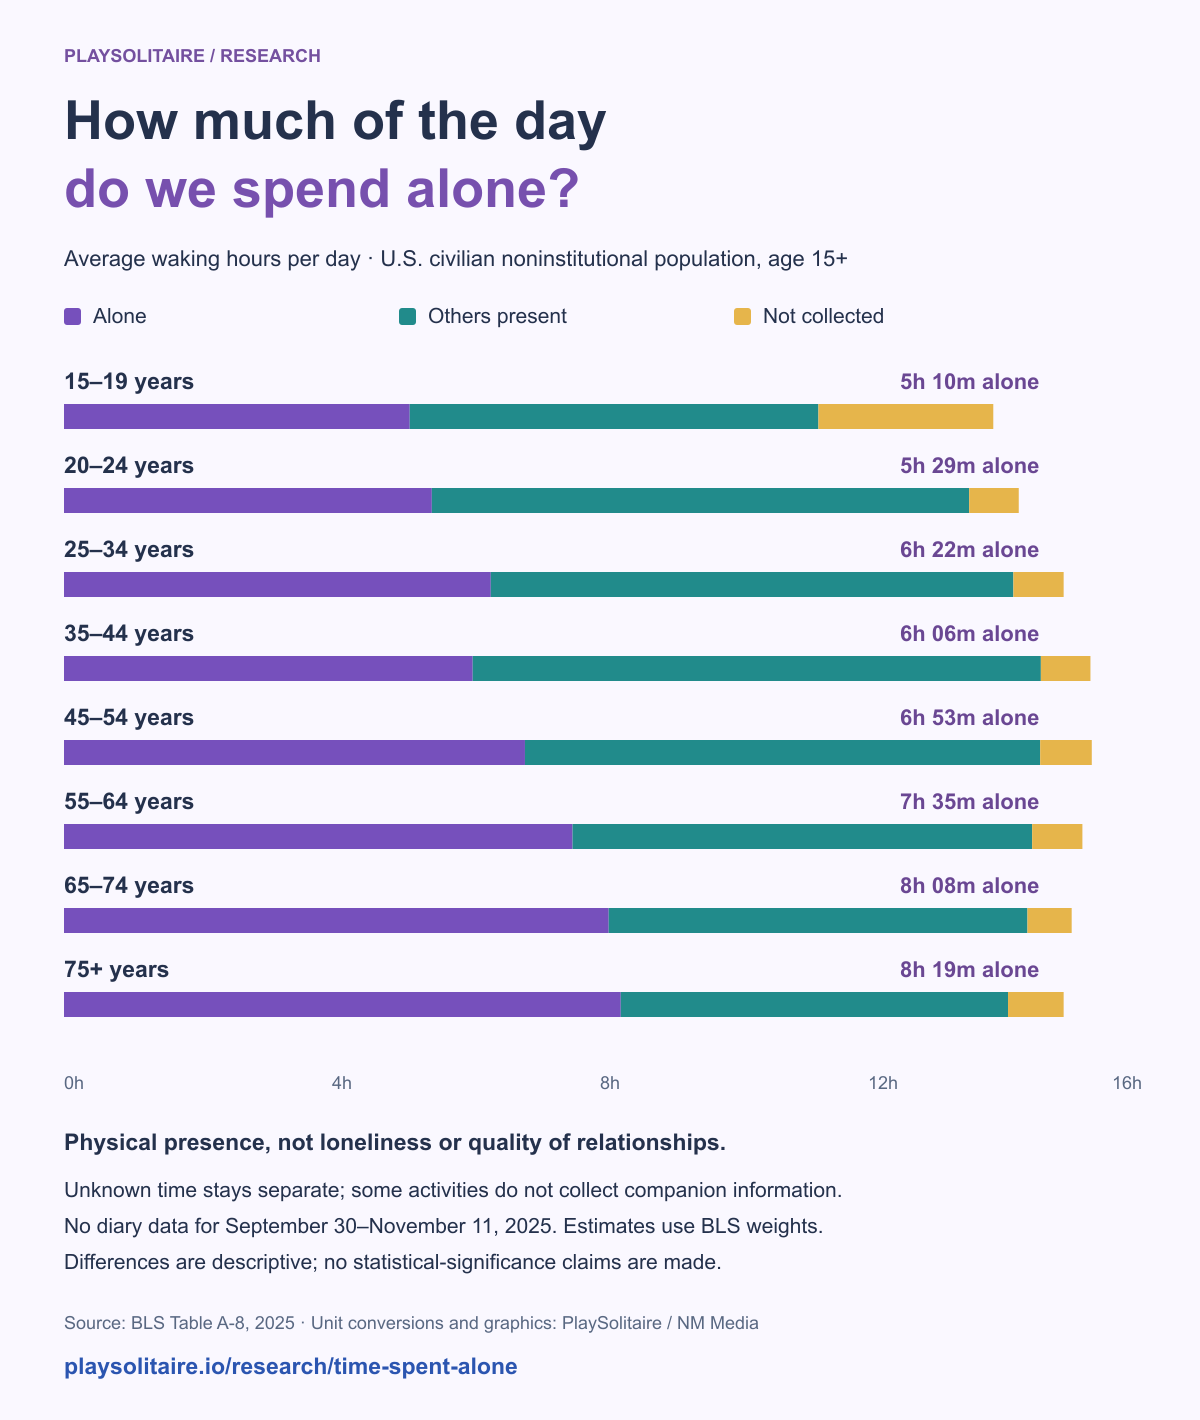
The published 2025 averages range from 5h 10m alone among 15–19-year-olds to 8h 19m among people age 75 and over. That is a comparison of different people in one year—not a prediction of how any person’s life will change as they age.
Alone, together, or not recorded
Every bar uses the same 0–16-hour scale. The number on the right shows time alone by default.
Full breakdown: purple is time alone; teal is time with others present; gold is information not collected. Exact values are in the data table.
Less recorded alone time does not mean every other hour was social.
For 15–19-year-olds, 2h 37m of waking time has no companion information. BLS does not collect it for high-school classes, grooming and certain personal activities; nonresponse can also contribute. The gold segment must stay separate.
Daily routines offer possible explanations for the pattern: attending school, working, caring for children and living with a partner change opportunities to be in the same room as someone else. These tables describe differences; they do not isolate which factors caused them.
02 / LIVING ARRANGEMENTS
Living alone and spending time alone are different things
People who lived alone averaged 10h 38m alone and 3h 42m with others present each day. Across that group, 61.3% spent at least some waking time with another person on an average day.
Who is around during the day?
These groups have different age bases and do not cover every living arrangement. Their averages are not adjusted for age, employment or other differences.
People living alone
Age 15+10h 38malone per day3h 42m with others present
0h 44m not collected
With spouse or partner, no children under 18
Age 15+6h 12malone per day8h 05m with others present
0h 45m not collected
Adults living with children under 18
Age 18+5h 14malone per day9h 16m with others present
0h 46m not collected
spent some waking time alone on an average day
spent some waking time with others present
Both describe all people age 15+. They overlap: a person can experience both during the same day. Source: BLS Table A-9.
The day of the week matters, too
Non-holiday weekdays averaged 7h 11m alone, compared with 5h 58m on weekends or holidays. The gap is about 1 hour 14 minutes, calculated from the rounded published estimates. The table covers waking activities throughout the day, including work.
A weekday and a weekend are different comparisons
alone per day
alone per day
03 / READ IT CAREFULLY
A setting is not a feeling
Someone was there.
A household member, friend or coworker could be physically present while the respondent did something else.
How the moment felt.
The table cannot tell us whether that time felt connected, awkward, restorative, lonely or simply ordinary.
A person can read next to a partner, exercise with a friend, or play an online game while physically alone. The setting and the activity are separate descriptions. That is why a solo game such as TriPeaks Solitaire tells us about the rules—a player removes cards one rank above or below the current card—but not who else is in the room.
The same applies to a two-deck layout such as Forty Thieves Solitaire: one person can make the moves while sharing the sofa or an evening with someone else. “Single-player” is not a measure of physical solitude.
Equally, someone arranging same-suit runs in Spider Solitaire 2 Suits may be alone or in company. These examples explain the distinction; the BLS tables do not identify individual games or show that playing changes loneliness.
04 / THE EVIDENCE
Sources, calculations and limits
This page visualizes selected rows from the Bureau of Labor Statistics’ published 2025 Table A-8 and 2025 Table A-9, accessed September 29, 2026. The estimates are BLS calculations from the American Time Use Survey. PlaySolitaire converted units and created the visualizations; we did not generate new estimates from respondent microdata.
- Population: U.S. civilian noninstitutional population age 15 and over. The “adults living with children under 18” group is age 18 and over. This is a U.S. comparison, not a claim about Canada or the UK.
- Time: average hours per day across each stated population, including people with zero time in a category. Waking time includes work, education, household tasks and leisure. Sleep is excluded.
- Presence: who was physically in the room or accompanying the respondent. “Information not collected” remains separate and includes specified activities and missing responses. It must not be counted as either alone or with others.
- Conversions: hours × 60, rounded to the nearest whole minute. Differences use the source’s decimal hours before rounding. Published components can differ from the awake total by 0.01 hour, so we do not force them to sum exactly.
- Uncertainty: the tables do not include standard errors. We make no statistical-significance claims, causal claims, or trend claims. Averages describe groups, not a typical schedule for every individual.
A gap in 2025 data collection
BLS reports no diary data for September 30–November 11, 2025 because of the federal shutdown. Its weights represent missing days, but cannot observe behavior during the gap. Read the BLS shutdown notice before treating these as a complete record of every part of the year.
The ATUS User’s Guide explains the survey design, weighting and time-diary method. Our downloadable data preserve the published decimals and name the source table for each row.
View all chart data in decimal hours
| Group | Awake | Alone | Others present | Not collected |
|---|---|---|---|---|
| All peopleAll people age 15+ | 14.97 | 6.82 | 7.25 | 0.89 |
| Age15–19 | 13.87 | 5.16 | 6.10 | 2.61 |
| Age20–24 | 14.25 | 5.49 | 8.02 | 0.74 |
| Age25–34 | 14.92 | 6.37 | 7.80 | 0.75 |
| Age35–44 | 15.32 | 6.10 | 8.48 | 0.74 |
| Age45–54 | 15.34 | 6.88 | 7.69 | 0.77 |
| Age55–64 | 15.21 | 7.59 | 6.86 | 0.75 |
| Age65–74 | 15.04 | 8.13 | 6.25 | 0.66 |
| Age75+ | 14.92 | 8.31 | 5.78 | 0.83 |
| Age 15+People living alone | 15.07 | 10.63 | 3.70 | 0.74 |
| Age 15+With spouse or partner, no children under 18 | 15.04 | 6.20 | 8.09 | 0.75 |
| Age 18+Adults living with children under 18 | 15.25 | 5.23 | 9.26 | 0.76 |
| Day typeNon-holiday weekdays | 15.24 | 7.19 | 7.09 | 0.97 |
| Day typeWeekends or holidays | 14.32 | 5.96 | 7.64 | 0.72 |
Use the figures, keep the context
Original charts, the transcribed table rows and a reproducible conversion script. Attribute BLS for the estimates and PlaySolitaire for the graphics, and keep the population and 2025 data-gap notes with the figures.