The Win-Rate Observatory
Solitaire Win Rates: Winnable vs Actually Won
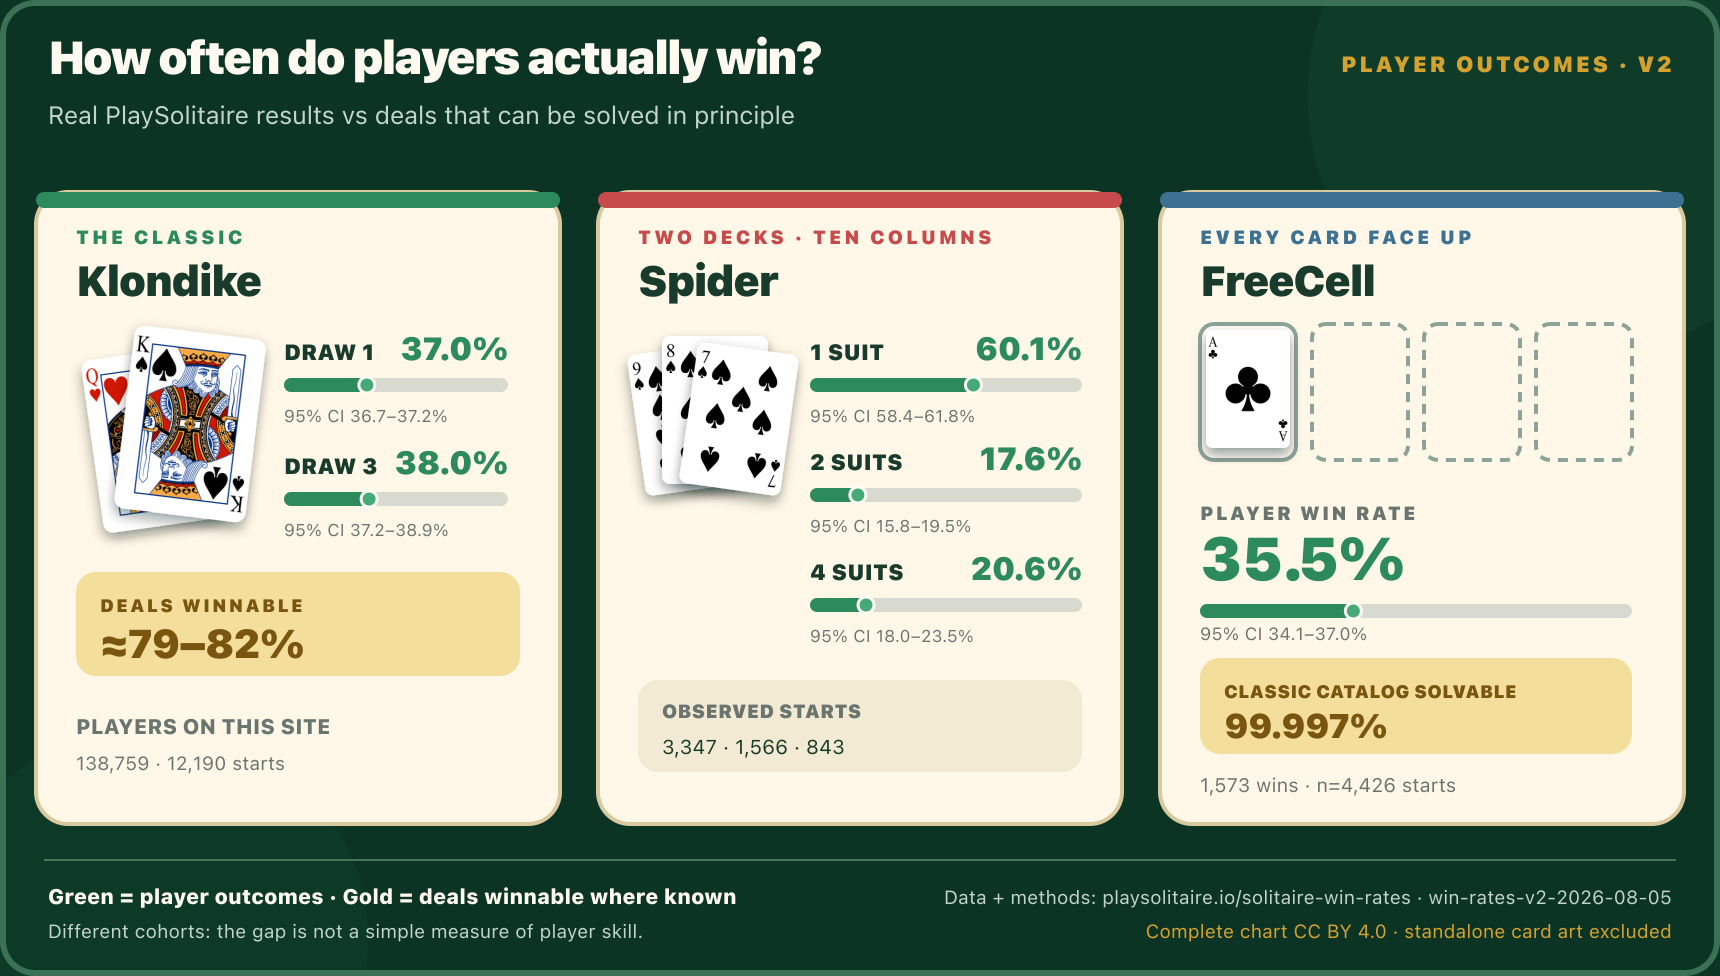
What percentage of Solitaire games do people actually win? In our corrected cohort, players won 37.0% of 138,759 Klondike Draw 1 starts (95% confidence interval: 36.7–37.2%). About 79–82% of Draw 1 deals may be winnable in principle. The gap is the difference between a possible solution and real play against hidden cards, ordinary mistakes and incomplete games.
- Draw 1 actually won
- 37.0% 95% CI 36.7–37.2%
- Eligible starts
- 138,759 Jul 15–Aug 3, 2026
- Draw 1 winnable
- ≈ 79–82% published literature estimate
Reusable visual resource
Solitaire win rates: winnable vs actually won
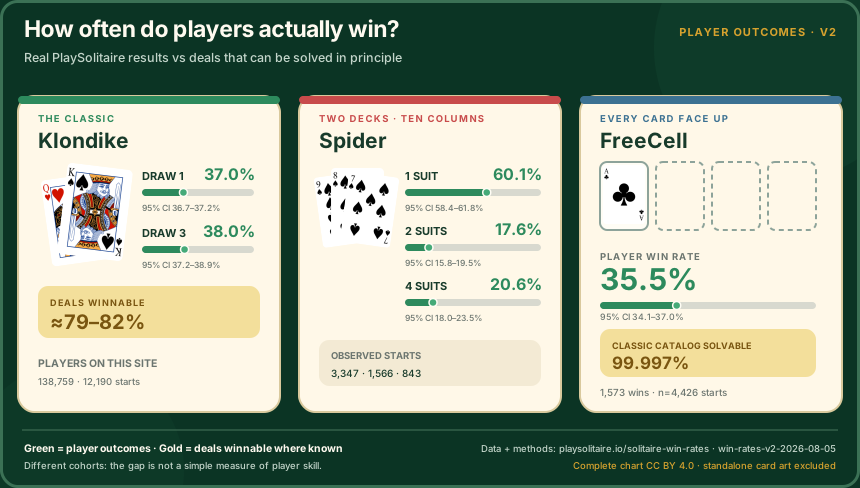
Corrected player outcomes for Jul 15–Aug 3, 2026, with 95% Wilson intervals beside separately labeled solvability evidence.
Solitaire win rates: winnable vs actually won — PlaySolitaire.io (https://playsolitaire.io/solitaire-win-rates#measured-win-rate-chart), CC BY 4.0
Complete results
Every game we run, measured and bounded
6 published 12 collecting
| Game | Won by players here | Winnable in principle | Notes |
|---|---|---|---|
| Klondike — Draw 1 | 37.0% 95% CI 36.7–37.2% 138,759 eligible starts · Jul 15–Aug 3, 2026 | ≈ 79–82% literature | Unlimited undo included; solvability is the published thoughtful-play estimate for Draw 1. |
| Klondike — Draw 3 | 38.0% 95% CI 37.2–38.9% 12,190 eligible starts · Jul 15–Aug 3, 2026 | — | Players self-select Draw 3, so this is not a same-player comparison with Draw 1. |
| Spider — 1 suit | 60.1% 95% CI 58.4–61.8% 3,347 eligible starts · Jul 15–Aug 3, 2026 | Practically every deal literature | |
| Spider — 2 suits (Random) | 17.6% 95% CI 15.8–19.5% 1,566 eligible starts · Jul 15–Aug 3, 2026 | Published verified pool: 90 of 90 exact 90 deals | Current unfiltered Random games only; legacy Random and verified difficulty tiers are excluded. |
| Spider — 4 suits | 20.6% 95% CI 18.0–23.5% 843 eligible starts · Jul 15–Aug 3, 2026 | Most deals — if the line can be found literature | |
| FreeCell | 35.5% 95% CI 34.1–37.0% 4,426 eligible starts · Jul 15–Aug 3, 2026 | 31,999 of 32,000 (99.997%) catalog 32,000 deals | the original Microsoft catalog; the modern 1,000,000-deal catalog is ≈99.999% See which numbered FreeCell deals cannot be won. |
| TriPeaks | Collecting data — fewer than 500 eligible starts | 96.6% exact 1,000 deals | |
| Pyramid | Collecting data — fewer than 500 eligible starts | ≥ 65.8% lower bound 1,520 deals | deals served on this site are pre-verified winnable — measured rates are on the curated pool |
| Golf (strict rules) | Collecting data — fewer than 500 eligible starts | ≈ 27% exact 2,000 deals | deals served on this site are pre-verified winnable — measured rates are on the curated pool |
| Yukon | Collecting data — fewer than 500 eligible starts | ≈ 75% lower bound | solver finds a full line on roughly three of four random deals within budget |
| Alaska | Collecting data — fewer than 500 eligible starts | ≈ 80% lower bound | solver finds a full line on about four of five random deals within budget |
| Scorpion | Collecting data — fewer than 500 eligible starts | ≥ 12.8% lower bound 1,000 deals | 224 of 1,000 deals undecided at the search budget |
| Wasp | Collecting data — fewer than 500 eligible starts | ≥ 77.9% lower bound 1,000 deals | |
| Forty Thieves | Collecting data — fewer than 500 eligible starts | ≥ 7.7% lower bound 1,000 deals | 923 of 1,000 deals unresolved by the bounded search (922 hit the 2M-node budget; 1 ended without a winning line); avg best line banks 40.6 of 104 |
| Crescent | Collecting data — fewer than 500 eligible starts | ≥ 45% lower bound 1,000 deals | with all 3 shuffles; per-shuffle floors 5.8/13.0/26.9/45.0% and unresolved counts 942/870/731/550 at the bounded search limits; avg best line banks 102.2 of 104 |
| Canfield | Collecting data — fewer than 500 eligible starts | ≥ 33.1% lower bound 1,000 deals | 441 of 1,000 proven lost within the 3-redeal search cap (play allows unlimited); 228 undecided at the 2M-node budget; avg best line banks 27.4 of 52 — $136.75 at the 1890s casino payout |
| Eight Off | Collecting data — fewer than 500 eligible starts | ≥ 97.7% lower bound 1,000 deals | 0 of 1,000 proven lost; 23 undecided at the 2M-node budget; avg best line banks 51.5 of 52 |
| Russian | Collecting data — fewer than 500 eligible starts | ≈ 7% exact 2,000 deals |
Measured column: corrected methodology v2, wins divided by eligible mature starts, with unlimited undo included. Low-volume counts are suppressed. The same published rows ship as versioned JSON and CSV. The frozen June methodology-v1 JSON remains separate.
Methodology summary
Methodology v2 joins each eligible start to at most one observed terminal result, keeps mature open starts in the denominator, excludes declared practice and curated Klondike pools, and reports a two-sided 95% Wilson interval. Read the complete reproducible methodology.
Winnable versus won: why the gap is so large
"Winnable" means a winning line exists for a player who somehow knows every card — including the face-down ones — and never wastes a move. Real Solitaire is played against hidden information, ordinary mistakes and sessions that end before a win. That is why the two columns tell different stories. The ceiling describes whether a deal has a solution; the corrected measured rate describes what happened after a valid start on this site.
How we measure real win rates
The published figures use methodology v2: wins divided by eligible mature starts from 15 July through 3 August 2026, with outcomes observed through 5 August. BigQuery joins each start to at most one terminal result by namespaced pseudonymous attempt identity and deduplicates event delivery. A mature start with no observed terminal remains in the denominator as not won. Practice boards, Daily games, Klondike winnable or golden pools and analytics-denied sessions are excluded. The frozen June methodology-v1 dataset remains available separately and is never blended into v2.
How the solvability ceilings are computed
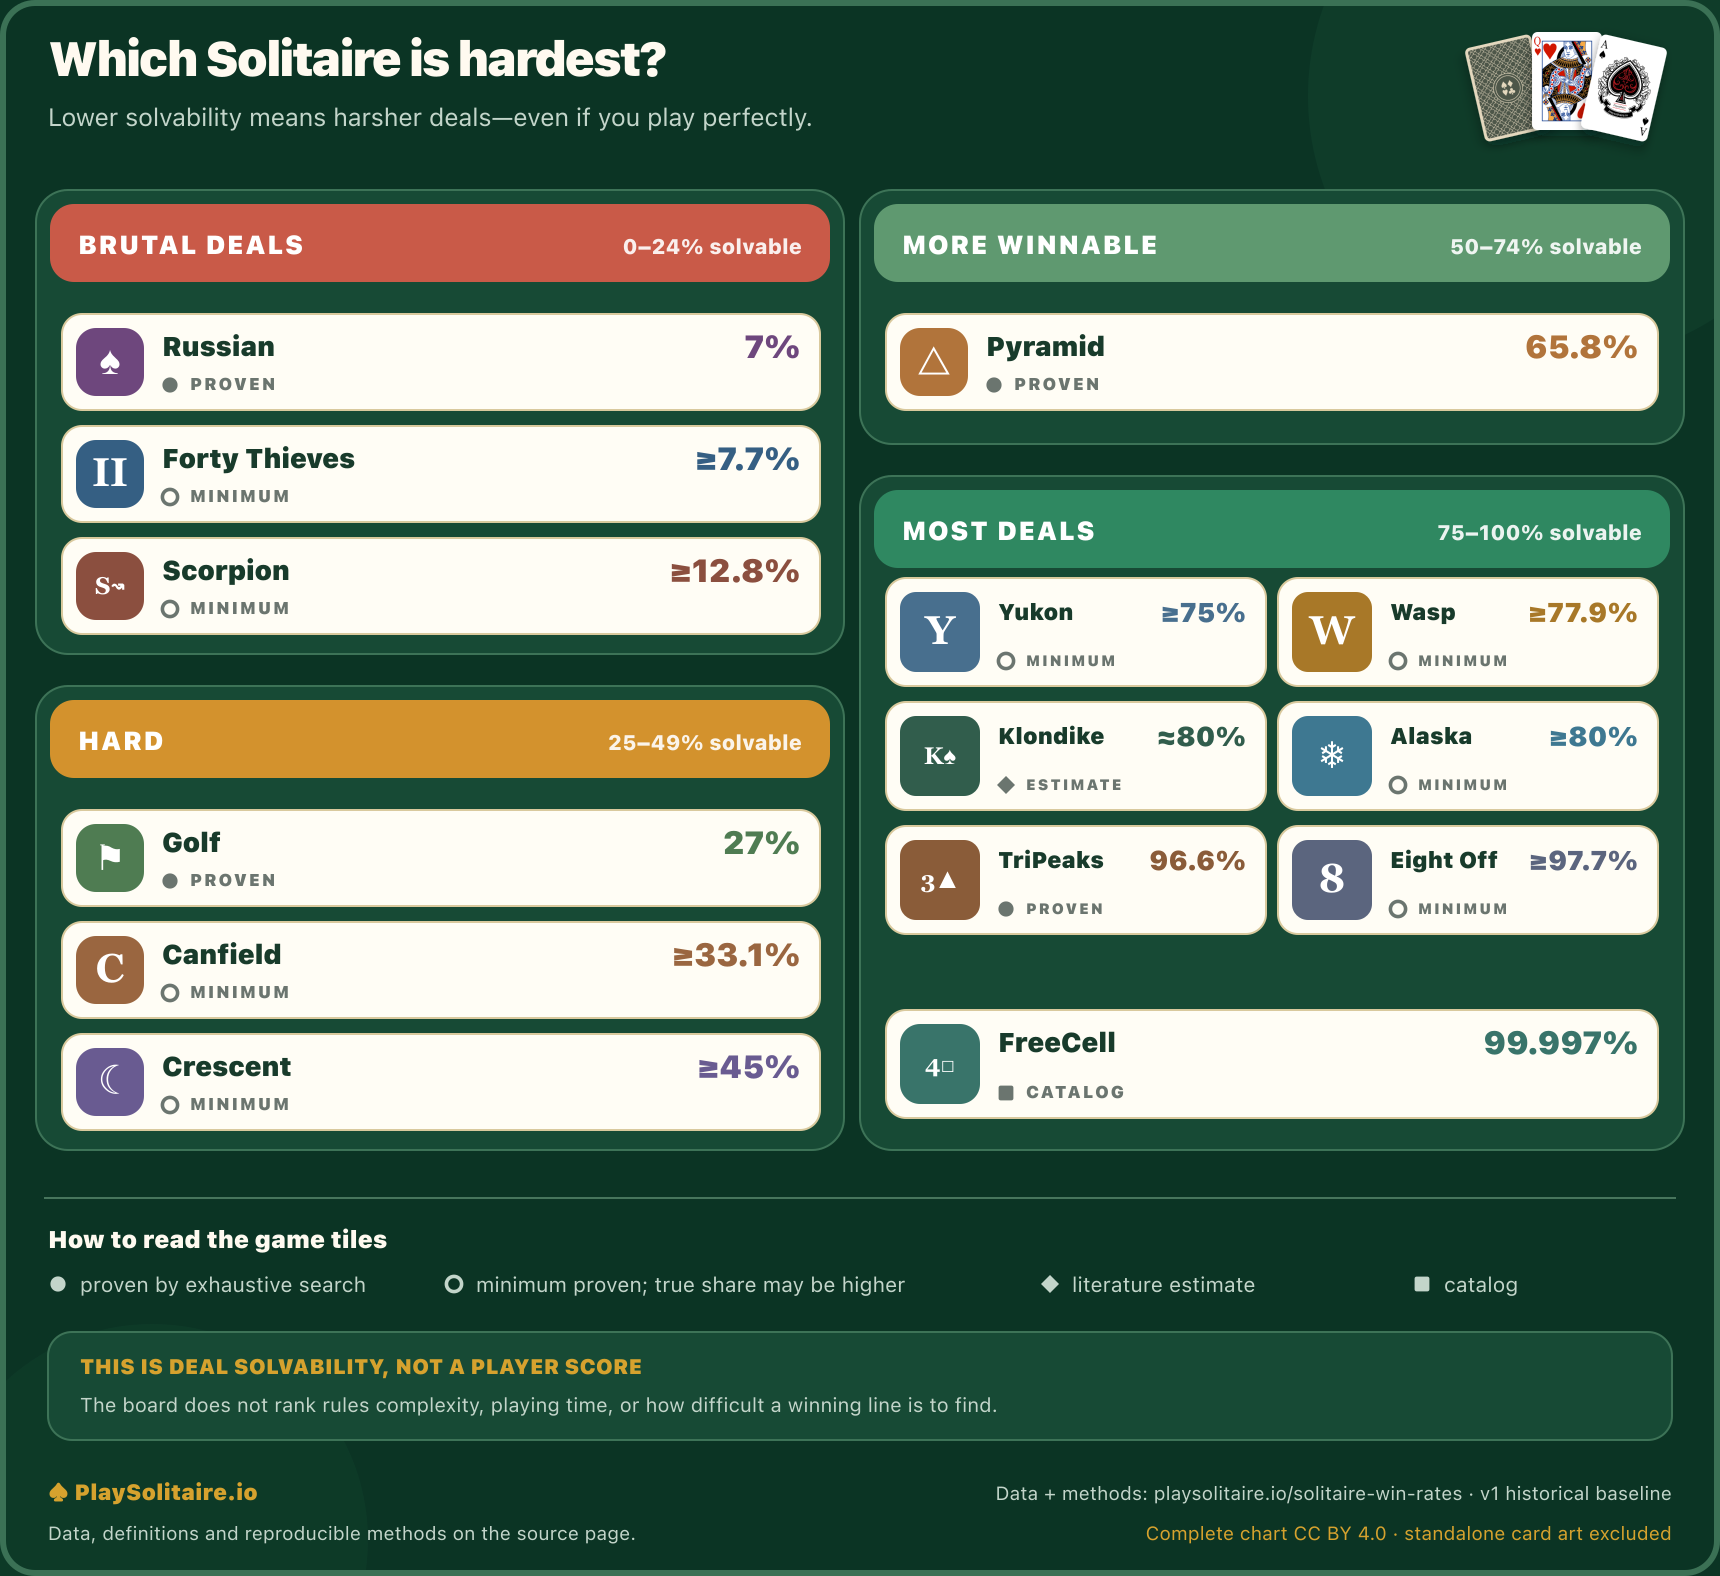
The table distinguishes four types of evidence. Exact: the solver classified every sampled deal under the tested rules — TriPeaks 96.6% of 1,000 deals, strict Golf about 27% of 2,000, and Russian solitaire about 7% of 2,000. Lower bound: a solution was found for at least the reported share; unsuccessful bounded searches do not settle every remaining deal. Pyramid’s original curation found 1,000 wins among 1,520 sequentially scanned deals, about 65.8%, with four searches reaching the budget. That is a lower bound for the stopped sample, not an exact population estimate. Other bounded results include Scorpion at least 12.8%, Wasp at least 77.9%, Yukon roughly three of four, and Alaska about four of five. Catalog: 31,999 of FreeCell’s original 32,000 numbered deals are winnable. Literature: for Klondike we quote the published estimate of 79–82% for thoughtful Draw 1 play, because we do not run a Klondike solver of our own. The methodology records the rules, source scripts and limits.
Reading the table honestly
Three caveats keep these numbers truthful. Self-selection: Draw 3 players won 38.0% while Draw 1 players won 37.0%; that does not make Draw 3 easier because players choose their mode. Different deal pools: current Random two-suit Spider is kept separate from legacy Random and every verified difficulty tier. Low volume: a row stays inconclusive until it has at least 500 eligible starts. The table never publishes a small-sample rate as settled evidence.
Solitaire win-rate FAQ
What percentage of solitaire games are winnable?
For classic Klondike, research puts thoughtful Draw 1 play at about 79–82% winnable. Other variants span a huge range: nearly every FreeCell deal is winnable, TriPeaks reaches 96.6%, while Russian solitaire bottoms out around 7%. The full table above lists every variant we run — and the more surprising number beside it: what players actually win.
What percentage of solitaire games do players actually win?
In the corrected cohort, players won 37.0% of 138,759 Klondike Draw 1 starts, 38.0% of 12,190 Draw 3 starts, 60.1% of 3,347 one-suit Spider starts, 17.6% of 1,566 current Random two-suit Spider starts, 20.6% of 843 four-suit Spider starts and 35.5% of 4,426 FreeCell starts. Each published row includes its 95% confidence interval.
What is the hardest solitaire game?
By solvability ceiling, Russian Solitaire: our solver settled 2,000 random deals exhaustively and only about 7% can be won by any line of play. Among the corrected player cohorts that currently clear the publication floor, current Random two-suit Spider is lowest at 17.6%. Those are different questions, so the table never treats measured completion as solvability.
Is every FreeCell game winnable?
Essentially — 31,999 of the original 32,000 numbered deals are provably winnable. Players in the corrected cohort won 35.5% of 4,426 eligible starts, which demonstrates that deal solvability and observed player completion are not the same measure.
Why are your numbers lower than other sites publish?
Many published Solitaire “win rates” are theoretical solvability figures or unsourced estimates. Ours are corrected attempt-level observations with exact samples, periods and 95% intervals. Real play and theoretical solvability answer different questions; the gap is a finding, not an error.
How often are these numbers updated?
Deliberately, not silently. Every release has an immutable dataset version, period and correction history. New games remain inconclusive until they clear 500 eligible starts, and every published JSON, CSV, chart and table must agree before release.
Cite or embed this data
Reusable visual resource
The solitaire difficulty ladder
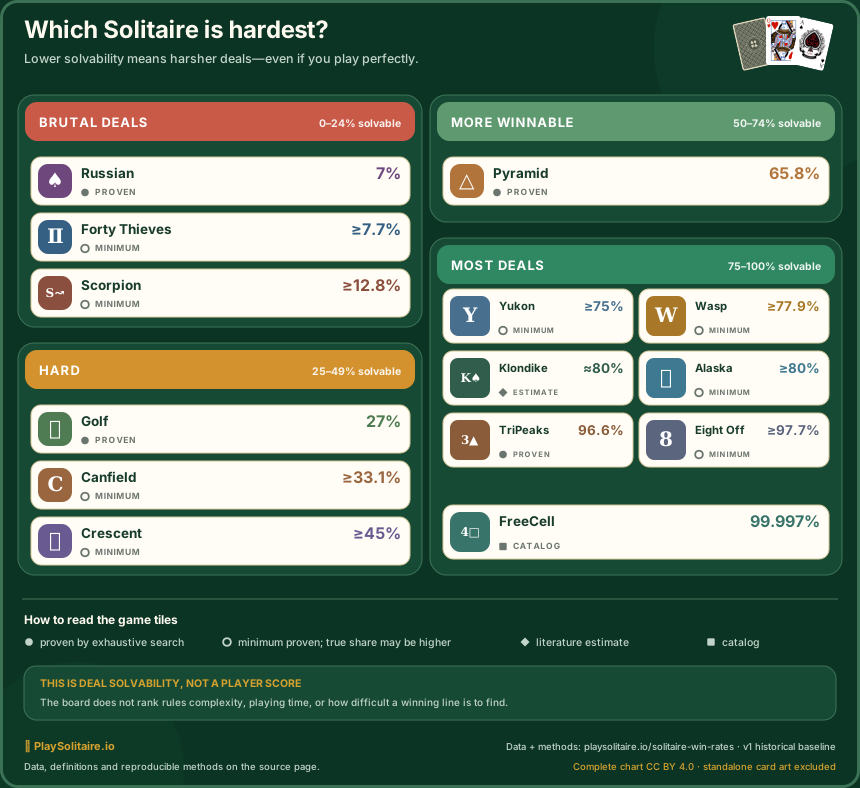
Solvability ceilings sorted from hardest to easiest. Striped cards mark estimates or lower bounds, so the chart does not turn uncertainty into false precision.
The solitaire difficulty ladder — PlaySolitaire.io (https://playsolitaire.io/solitaire-win-rates#difficulty-ladder-resource), CC BY 4.0
The charts, the table above, and the versioned JSON dataset and matching CSV are licensed CC BY 4.0 — free to republish, remix, and hotlink, with one condition: credit this page with a link (details in our copyright note). Each resource above provides ready-to-paste HTML, Markdown, and plain-text attribution.
Text citation: PlaySolitaire.io Win-Rate Observatory, https://playsolitaire.io/solitaire-win-rates (CC BY 4.0), win-rates-v2-2026-10-09, corrected methodology v2.