ResearchPsychology & everyday choices
Good decision.
Bad outcome.
Sometimes the better choice ends badly. Sometimes a weak plan gets lucky. Here is how to tell the decision from the result.
A chance.
Not a promise.
Choosing the option with a 75% chance of success still leaves room for the other 25%.
The ending changes. What was knowable before the choice does not.
A carefully planned journey gets delayed. A rushed project happens to land well. Looking backward, the ending can become the whole story.
Outcome bias means letting how a choice turned out distort the evaluation of the choice itself. In their 1988 experiments, Jonathan Baron and John C. Hershey found that favorable results led people to judge the preceding decisions more positively.
The useful question is more specific than “Did it work?” It is: given the goal, alternatives and information available then, did the choice make sense?
01 / TWO DIFFERENT QUESTIONS
A good result and a good decision are separate things
A sound choice takes the available evidence, realistic alternatives and consequences seriously. It can still carry risk. A weak choice can skip those steps and happen to succeed.
Four possibilities, not two
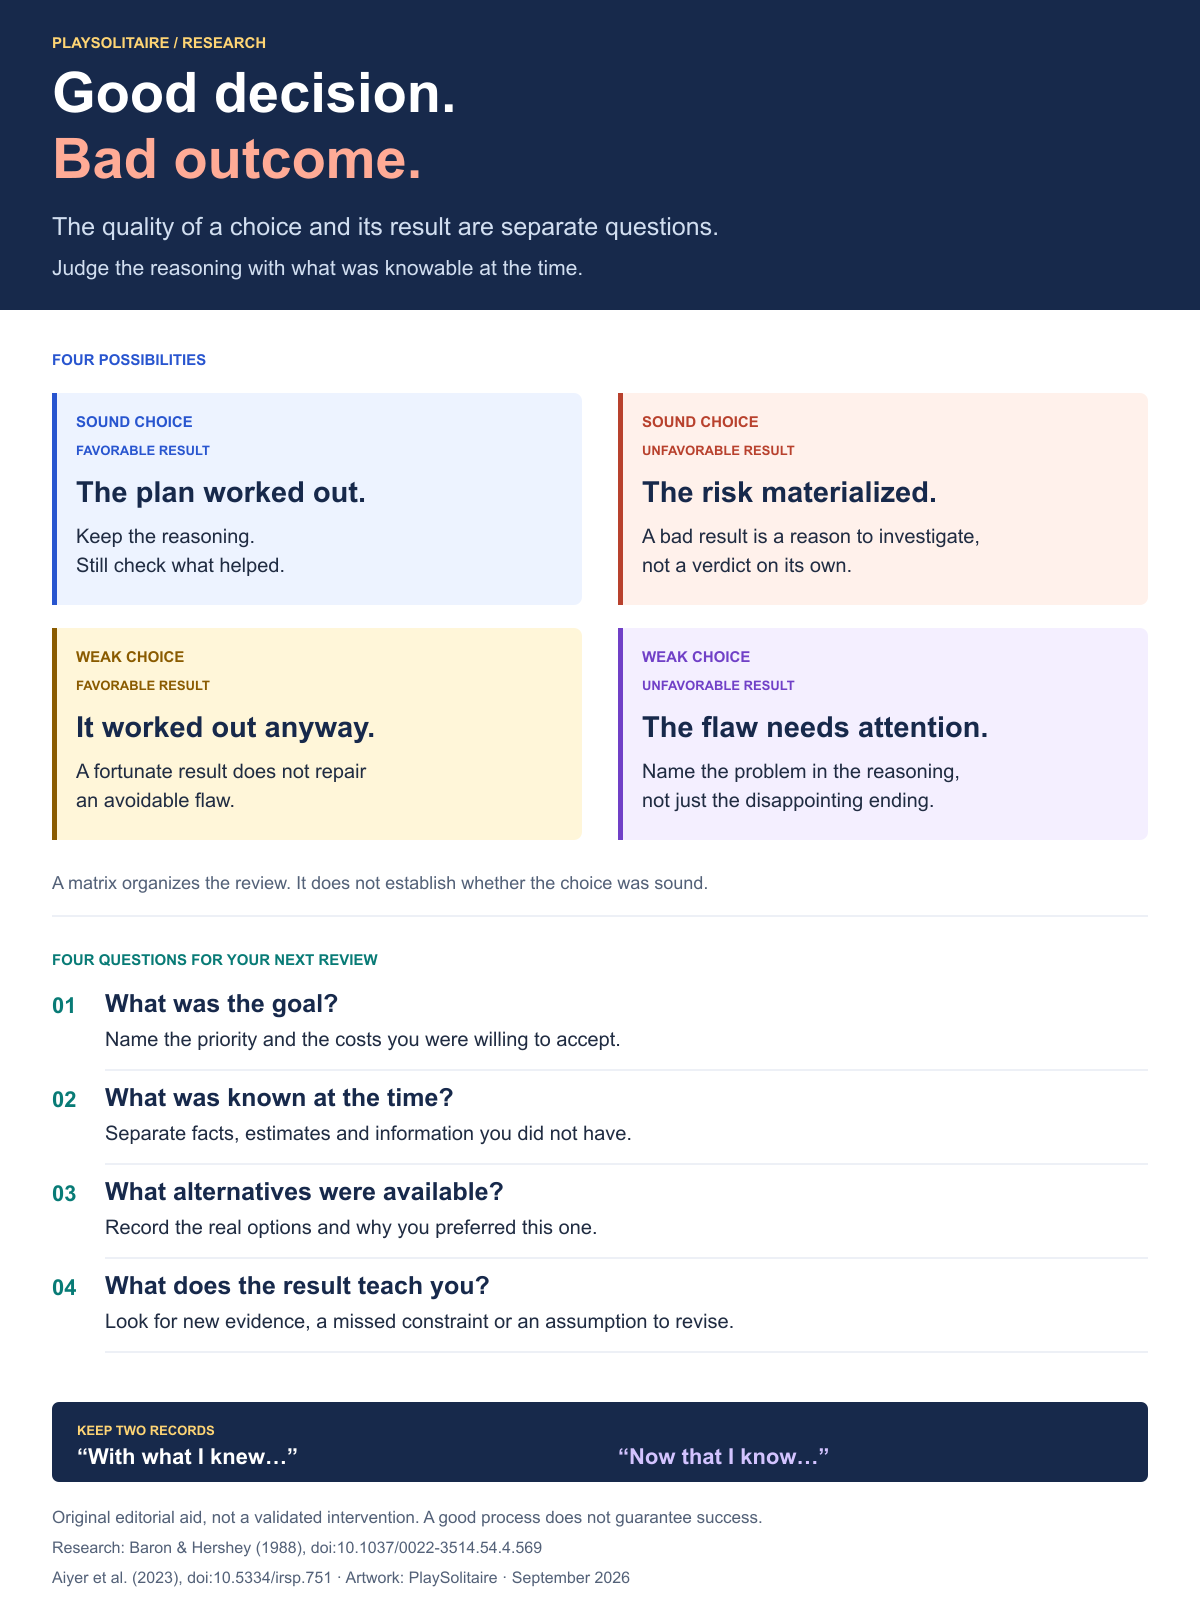
Read each card as a combination of the choice and its result.
Favorable result
The plan worked out.
Keep the reasoning. Still check what helped.
Unfavorable result
The risk materialized.
A bad result is a reason to investigate, not a verdict on its own.
Favorable result
It worked out anyway.
A fortunate result does not repair an avoidable flaw.
Unfavorable result
The flaw needs attention.
Name the problem in the reasoning, not just the disappointing ending.
The distinction does not make every loss bad luck. In FreeCell, every card starts face up. A fixed deal followed by the same moves has the same result. The question is whether the player’s plan overlooked a visible constraint, not whether the game secretly changed the cards.
02 / HOLD THE FACTS STILL
Change the ending. Does the choice change?
Imagine sending one parcel. Your only objective is to maximize its chance of arriving by a deadline. There are two couriers. Their prices and all other relevant consequences are identical, and the probabilities below are known.
Which part changed?
Authored example. Choose a courier, then an ending. This is not a test of your judgment.
Same price · same deadline · same objective
Only the on-time probability differs.
Both results are possible.
Courier A has the higher on-time probability. Choose an ending to see whether it changes that comparison.
A has a 25-percentage-point advantage over B for this one objective.
Hidden information makes the timing especially clear. In Solitaire Turn 3, an unseen stock card can become known later. That reveal can guide the next move, but it was not evidence available for the earlier one. Cards already seen on a previous pass are a different case.
03 / THE RESEARCH
The result changed how people rated the decision
A 2023 preregistered replication by Aiyer and colleagues analyzed 692 online participants. Different groups read versions of one hypothetical medical scenario, varying who chose the operation and whether it succeeded. Successful outcomes received higher decision-quality ratings.
Same choice, different evaluations
Mean decision-quality rating on a −3 to +3 scale.
This is evidence about that experiment, not a percentage of people who are biased. The single scenario and online sample limit generalization; there was no outcome-unknown comparison group. The study did not measure players or test the review prompts below.
View the reported values and sample sizes
| Decision-maker / outcome | Mean | SD | People |
|---|---|---|---|
| Physician / success | 1.81 | 0.84 | 173 |
| Physician / failure | 0.45 | 1.55 | 172 |
| Patient / success | 1.76 | 0.79 | 171 |
| Patient / failure | 0.90 | 1.36 | 176 |
SD describes variation in individual ratings. It is not a confidence interval. Values are transcribed as reported, not recalculated from participant records.
04 / A MORE USEFUL REVIEW
Keep two records: what you knew, and what you learned
Try writing down the reason for a choice before you know how it ends. A brief record gives a later review something more concrete than a reconstructed explanation. These prompts are an editorial aid, not a proven cure for bias.
Start before the ending
- 01
What was the goal?
Name the priority and the costs you were willing to accept.
- 02
What was known at the time?
Separate observed facts, estimates and information you did not have.
- 03
What alternatives were available?
Record the real options and why you preferred this one.
- 04
What does the result teach you?
Look for new evidence, a missed constraint or an assumption to revise.
Rules supply a concrete constraint in Forty Thieves Solitaire: cards move one at a time, and the stock allows one pass. A review can identify the legal alternatives and why an empty column was used. Simply recording “won” or “lost” leaves that reasoning out.
“With what I knew…”
State the evidence and reason that existed when you chose.
“Now that I know…”
State what the result adds and what you would check next time.
Results are feedback, not a time machine
A disappointing delivery might expose an unreliable estimate or an overlooked constraint. A successful one might still reveal an avoidable mistake. Investigate both. New evidence can change the next decision—and may uncover a real flaw in the earlier process.
The point is to ask what the result actually tells you, instead of treating the ending as the entire explanation. In the courier model the probabilities were given. In real life, their reliability is often one of the things you need to examine.
Sources, methods and limits
This is a research-based explainer with original teaching graphics, not a new experiment or a study of PlaySolitaire users.
- Baron & Hershey (1988), Outcome Bias in Decision Evaluation. Journal of Personality and Social Psychology, 54(4), 569–579. Foundational experiments and the distinction between evaluating a choice and learning from results.
- Aiyer et al. (2023), replication and extensions of Experiment 1. International Review of Social Psychology, 36(1), 12. Figure 3 uses the Evaluation row of Table 5; methods and limitations are reported in the paper.
The 75% and 50% courier probabilities are invented for the example. The model assumes equal prices, identical other consequences and one stated objective. Its buttons select outcomes deliberately. The matrix, model and worksheet are our illustrations, not instruments used in either study.
Sources checked September 27, 2026. Study values are rounded as published. The chart’s scale is −3 to +3; ratings are not success probabilities.
A visual card for your next review
Save the four possibilities and review questions, or inspect the numbers behind the research chart.