Research/Travel & everyday life
Which airports take the biggest bite out of your time?
A late departure can turn a quick trip into a long wait. We analyzed a year of U.S. flight records to compare 50 busy airports—by how often flights run late, and by how long.
Chicago O'Hare International
Chicago, IL
22.2minaverage positive departure delay
per completed flight with data
Early departures count as zero.
Cancelled and diverted flights are separate.
You can plan the journey to the airport. What happens after the departure board changes to “delayed” is harder to control. Airport averages cannot predict your next flight, but they can show where late departures have taken a larger share of travelers’ time.
We examined 7,043,858 flight records from the Bureau of Transportation Statistics (BTS), then compared the 50 highest-volume eligible origin airports in that dataset. Together, those airports account for 5,507,238 scheduled flights in the twelve months ending July 2026.
01 / WHERE TIME ADDS UP
Three measures. Three different leaders.
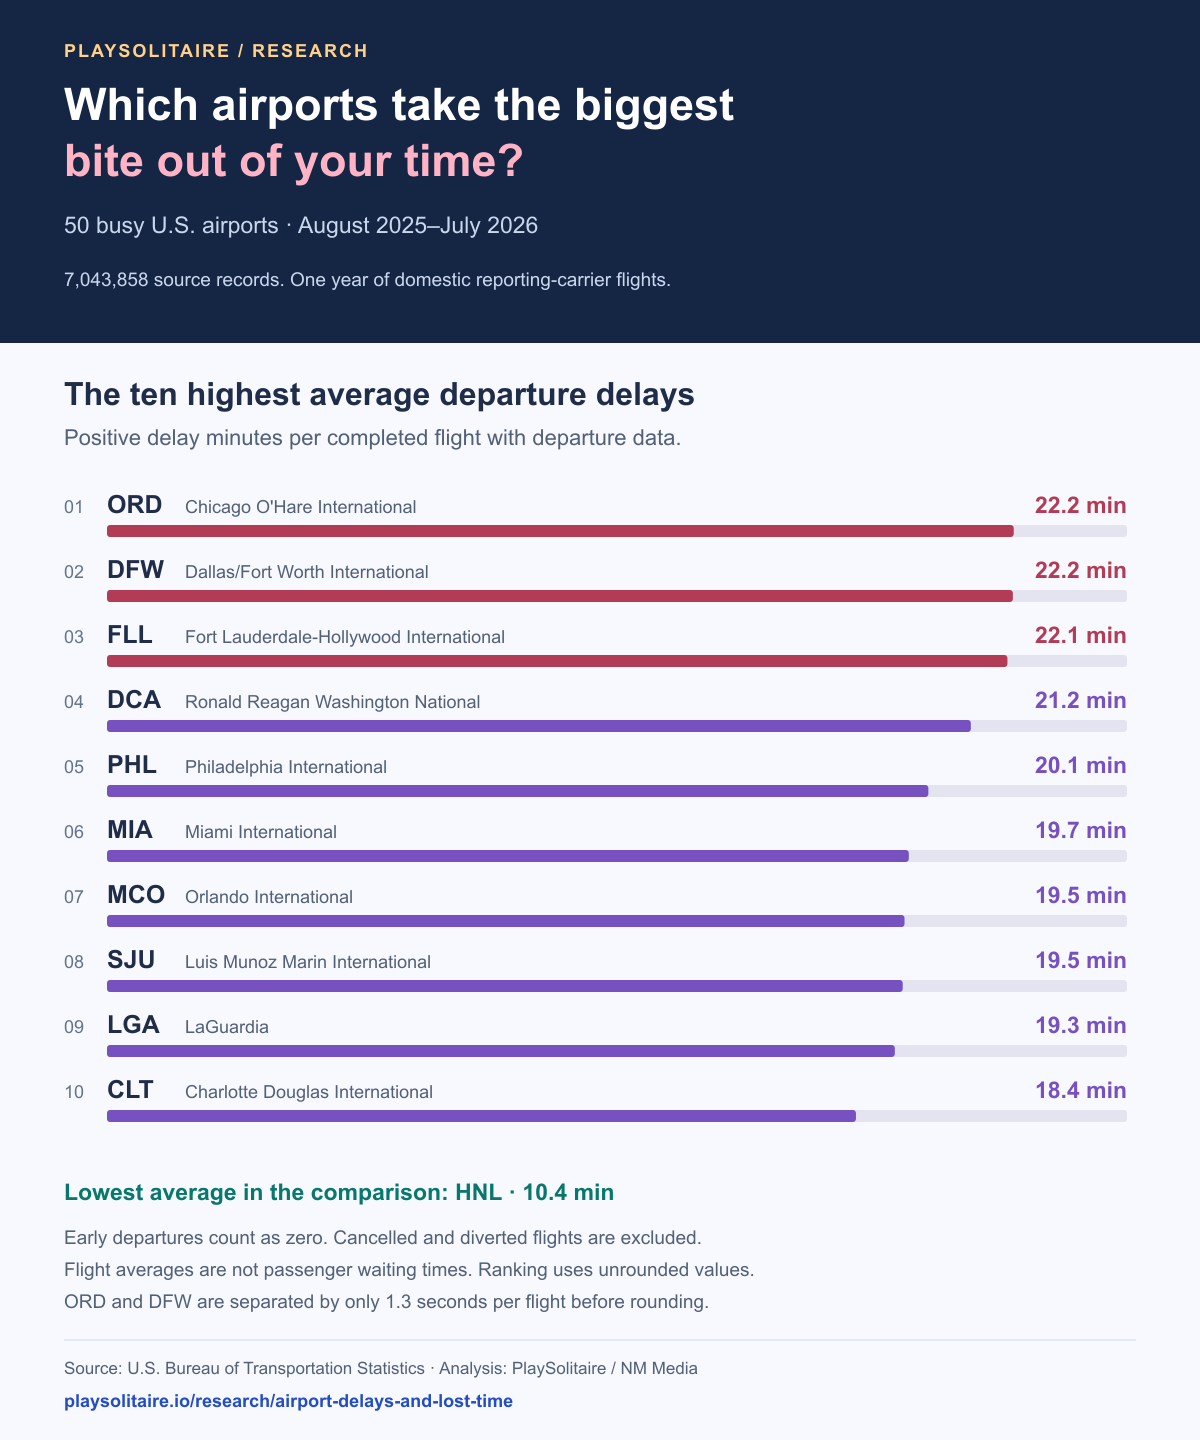
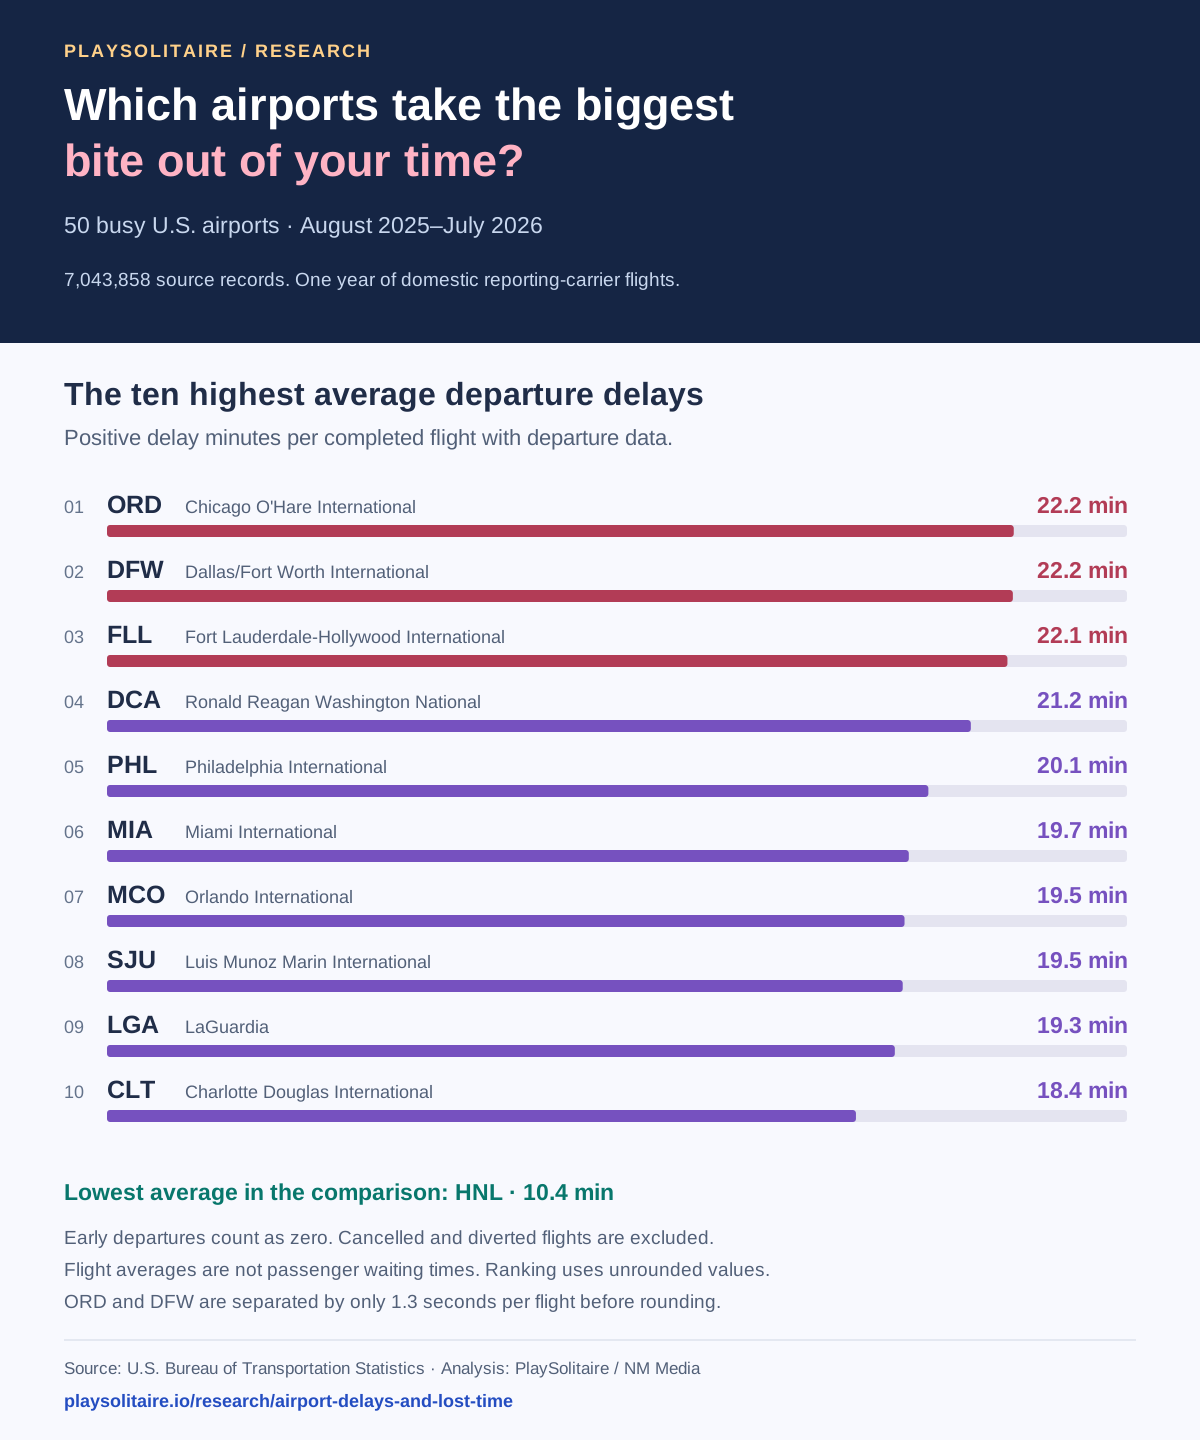
Chicago O'Hare International (ORD) had the highest average positive departure delay among the 50 airports: 22.2 minutes. At the other end, Daniel K Inouye International (HNL) averaged 10.4 minutes. Early departures do not erase late ones in this measure; they contribute zero minutes.
A close finish, not a wide lead. ORD and DFW are separated by just 1.3 seconds per flight before rounding. Small rank differences should not carry more weight than that gap deserves.
Average positive delay per completed flight with data.
Share of measurable completed flights delayed 15+ minutes.
Average departure delay among flights delayed 15+ minutes.
Where late departures add up most
Minutes of positive departure delay per completed flight with data. All 50 airports are in the table below.
Frequency and duration answer different questions. A departure that is 20 minutes late and one that is three hours late both count once in the 15-minute delay rate. The average delay among late flights helps reveal that difference.
How often? How long?
Each dot is one airport. Farther right means delays are more frequent; higher means late flights wait longer to depart.
02 / FIND YOUR AIRPORT
Put your departure airport in context
A single average can feel remote. Pick an airport to see its delay rate out of 100 completed flights with departure data. A flight leaving fewer than 15 minutes late is in the first group—even if it misses its exact scheduled time.
Chicago O'Hare International
ORD · Chicago, IL
100 flight symbols · proportions rounded
348,736 completed flights with departure data.
2.8% of scheduled flights were cancelled.
50 airports, four useful measures
Default order: highest average positive delay first. Rank always refers to that measure.
Showing all 50 airports
| Rank | Airport | Avg. delayper completed flight* | 15+ min lateof completed flights* | When lateavg. delay, 15+ min | Cancelledof scheduled flights |
|---|---|---|---|---|---|
| 1 | ORDChicago O'Hare InternationalChicago, IL | 22.2 min | 26.5% | 79.9 min | 2.8% |
| 2 | DFWDallas/Fort Worth InternationalDallas/Fort Worth, TX | 22.2 min | 28.9% | 73.3 min | 2.8% |
| 3 | FLLFort Lauderdale-Hollywood InternationalFort Lauderdale, FL | 22.1 min | 29.9% | 70.0 min | 2.4% |
| 4 | DCARonald Reagan Washington NationalWashington, DC | 21.2 min | 26.5% | 76.4 min | 3.6% |
| 5 | PHLPhiladelphia InternationalPhiladelphia, PA | 20.1 min | 23.8% | 80.6 min | 2.7% |
| 6 | MIAMiami InternationalMiami, FL | 19.7 min | 25.9% | 71.9 min | 1.6% |
| 7 | MCOOrlando InternationalOrlando, FL | 19.5 min | 26.4% | 69.5 min | 1.7% |
| 8 | SJULuis Munoz Marin InternationalSan Juan, PR | 19.5 min | 23.9% | 76.6 min | 2.0% |
| 9 | LGALaGuardiaNew York, NY | 19.3 min | 23.9% | 77.4 min | 4.6% |
| 10 | CLTCharlotte Douglas InternationalCharlotte, NC | 18.4 min | 24.4% | 71.0 min | 2.0% |
| 11 | DALDallas Love FieldDallas, TX | 18.3 min | 31.6% | 52.7 min | 1.4% |
| 12 | AUSAustin - Bergstrom InternationalAustin, TX | 18.3 min | 24.9% | 68.8 min | 1.2% |
| 13 | BOSLogan InternationalBoston, MA | 18.3 min | 23.4% | 74.3 min | 2.8% |
| 14 | RSWSouthwest Florida InternationalFort Myers, FL | 18.2 min | 21.5% | 80.5 min | 1.9% |
| 15 | JFKJohn F. Kennedy InternationalNew York, NY | 18.2 min | 21.8% | 79.6 min | 3.5% |
| 16 | BNANashville InternationalNashville, TN | 17.9 min | 27.9% | 59.2 min | 1.5% |
| 17 | SFOSan Francisco InternationalSan Francisco, CA | 17.8 min | 24.1% | 69.4 min | 1.0% |
| 18 | DTWDetroit Metro Wayne CountyDetroit, MI | 17.7 min | 21.2% | 79.4 min | 1.9% |
| 19 | RDURaleigh-Durham InternationalRaleigh/Durham, NC | 17.6 min | 20.6% | 80.7 min | 2.3% |
| 20 | STLSt Louis Lambert InternationalSt. Louis, MO | 17.5 min | 24.9% | 65.1 min | 1.3% |
| 21 | MSYLouis Armstrong New Orleans InternationalNew Orleans, LA | 17.2 min | 22.8% | 71.0 min | 1.5% |
| 22 | IAHGeorge Bush Intercontinental/HoustonHouston, TX | 17.1 min | 20.9% | 76.8 min | 1.1% |
| 23 | TPATampa InternationalTampa, FL | 17.0 min | 22.3% | 71.1 min | 1.6% |
| 24 | EWRNewark Liberty InternationalNewark, NJ | 16.9 min | 20.1% | 79.9 min | 3.1% |
| 25 | CLECleveland-Hopkins InternationalCleveland, OH | 16.7 min | 18.8% | 84.2 min | 2.3% |
| 26 | SANSan Diego InternationalSan Diego, CA | 16.6 min | 25.6% | 59.9 min | 1.3% |
| 27 | MDWChicago Midway InternationalChicago, IL | 16.5 min | 28.1% | 52.9 min | 1.5% |
| 28 | DENDenver InternationalDenver, CO | 16.5 min | 23.7% | 64.2 min | 0.7% |
| 29 | BWIBaltimore/Washington International Thurgood MarshallBaltimore, MD | 16.4 min | 27.0% | 55.0 min | 1.8% |
| 30 | LASHarry Reid InternationalLas Vegas, NV | 16.3 min | 25.6% | 58.3 min | 0.9% |
| 31 | CVGCincinnati/Northern Kentucky InternationalCincinnati, OH | 16.1 min | 18.6% | 82.2 min | 1.9% |
| 32 | PHXPhoenix Sky Harbor InternationalPhoenix, AZ | 15.8 min | 23.2% | 62.7 min | 0.9% |
| 33 | MCIKansas City InternationalKansas City, MO | 15.6 min | 20.9% | 68.7 min | 1.5% |
| 34 | SNAJohn Wayne Airport-Orange CountySanta Ana, CA | 15.2 min | 20.2% | 70.1 min | 1.1% |
| 35 | LAXLos Angeles InternationalLos Angeles, CA | 15.0 min | 20.2% | 69.6 min | 0.9% |
| 36 | ATLHartsfield-Jackson Atlanta InternationalAtlanta, GA | 15.0 min | 21.5% | 65.5 min | 1.8% |
| 37 | INDIndianapolis InternationalIndianapolis, IN | 14.9 min | 19.0% | 73.4 min | 1.9% |
| 38 | HOUWilliam P HobbyHouston, TX | 14.9 min | 26.6% | 50.4 min | 0.9% |
| 39 | CMHJohn Glenn Columbus InternationalColumbus, OH | 14.9 min | 18.8% | 74.6 min | 2.0% |
| 40 | MSPMinneapolis-St Paul InternationalMinneapolis, MN | 14.8 min | 19.0% | 73.4 min | 1.4% |
| 41 | SATSan Antonio InternationalSan Antonio, TX | 14.7 min | 18.7% | 73.5 min | 1.2% |
| 42 | IADWashington Dulles InternationalWashington, DC | 14.7 min | 16.2% | 85.2 min | 1.4% |
| 43 | PITPittsburgh InternationalPittsburgh, PA | 14.4 min | 17.6% | 76.4 min | 2.0% |
| 44 | OAKOakland InternationalOakland, CA | 13.4 min | 24.0% | 49.6 min | 0.6% |
| 45 | SEASeattle/Tacoma InternationalSeattle, WA | 13.1 min | 21.0% | 56.7 min | 0.9% |
| 46 | SMFSacramento InternationalSacramento, CA | 12.1 min | 19.4% | 56.3 min | 0.7% |
| 47 | PDXPortland InternationalPortland, OR | 11.5 min | 16.6% | 63.0 min | 0.7% |
| 48 | SLCSalt Lake City InternationalSalt Lake City, UT | 10.9 min | 15.3% | 66.1 min | 0.8% |
| 49 | SJCNorman Y. Mineta San Jose InternationalSan Jose, CA | 10.9 min | 18.5% | 52.8 min | 0.7% |
| 50 | HNLDaniel K Inouye InternationalHonolulu, HI | 10.4 min | 15.7% | 56.7 min | 0.9% |
*With a recorded departure delay; early departures contribute zero to the average. Cancelled and diverted flights are excluded. On narrow screens, scroll the table sideways.
No airports match. Try a three-letter code or reset the search.
03 / THE CALENDAR MATTERS
A year’s average can hide a difficult month
Across these same 50 airports, Jul 26 had the highest average positive departure delay, at 24.4 minutes. Sep 25 had the lowest, at 12.3 minutes. These are flight-weighted averages: a busier airport contributes more flights, not just one vote.
Departure delays month by month
Average positive delay per measurable completed flight. Every bar starts at zero and uses the same scale.
For a connection or a time-sensitive arrival, the useful question is more specific than “Is this a good airport?” It is whether the route, airline, departure time and margin in your itinerary work for you. This comparison pools those different circumstances, so treat it as background context rather than a recommended connection-time calculator.
WHEN THE DEPARTURE BOARD CHANGES
Make a waiting plan you can interrupt
A delayed departure is not an appointment with a fixed end time. Keep boarding announcements and gate information in view, and choose something you can put down easily: a chapter of a book, a saved article, or a solo card game.
A longer layout, without a deadline
If you enjoy working through a larger card layout, Forty Thieves Solitaire uses two decks. Treat it as an optional way to occupy a wait, with no promise that a deal will finish before boarding.
A choice you can make on your own
Reading, sketching and FreeCell can all be solo activities. FreeCell begins with the tableau face up, which gives you something concrete to examine whenever you return your attention to the cards.
Change the format, keep it optional
For a different card arrangement during a layover, Spider Solitaire 2 Suits asks you to build same-suit runs. Stop when your journey needs your attention; completing a game is not part of the travel plan.
If you prefer a familiar single-deck layout, Solitaire Turn 1 reveals one stock card at a time. Keep the game secondary to gate updates, just as you would with a book or a crossword.
These are editorial activity suggestions. Flight records do not measure whether playing games changes the experience of a delay.
04 / THE EVIDENCE
Methodology, sources and limits
PlaySolitaire analyzed the BTS Reporting Carrier On-Time Performance monthly files for August 1, 2025–July 31, 2026, downloaded September 29, 2026. July was the latest available month when the files were retrieved. This is an original analysis of public administrative records, not a passenger survey.
- Choose the comparison set before ranking delays. Group flights by
OriginAirportID. Require at least 20,000 completed flights with a recorded departure delay, and no more than 0.5% missing delay values among completed flights. Select the 50 airports with the most scheduled flights. There were 66 eligible airports from 359 origins in the files. “Busy” describes this dataset, not an FAA hub classification. - Separate flight outcomes. Flights with
Cancelled = 1orDiverted = 1do not enter the delay averages or delay shares. Cancellation and diversion rates use all scheduled records. The selected airports contain 99,048 cancellations, 15,320 diversions and 5,392,870 other completed flights; 0 completed flights lack a usable departure delay. - Measure departure delay consistently. Average positive delay = sum of
max(DepDelay, 0)divided by completed flights with recorded delay. Delay frequency = flights withDepDelay ≥ 15divided by that same denominator. “When late” averagesDepDelayonly among flights delayed 15+ minutes. The 60-minute measure uses the same completed-flight denominator. - Weight by flights, not airports or passengers. Monthly totals pool the same 50 airports. Rankings use unrounded values; displayed values round to one decimal. The calculation checks the raw delay fields against BTS’s positive-delay and 15-minute indicator fields.
What this study cannot tell you
Reporting-carrier domestic coverage is not all flights, all airlines or international service. Each flight counts equally regardless of aircraft size or passenger load. Airline mix, routes, schedules and disruption patterns differ by airport. A high average does not establish airport fault, a typical passenger’s wait, or the probability that your particular flight will be late. Averages can be pulled up by a small number of long delays.
Primary sources
- BTS monthly on-time performance ZIP archive
- BTS field definitions: delay, cancellation and diversion
- BTS dataset scope and release archive
- BTS airport ID and name lookup
Take the evidence with you
Download the comparison, the underlying counts and the reproduction script. Please credit BTS for the source records and PlaySolitaire for the analysis and chart, and link to this study.